Reports and Compare: How Did Two Sources Look at the Same Event?
It is the analysis screen calculating which source produced how much news and with how many minutes of difference and with what headlines they gave the same event compared to each other.
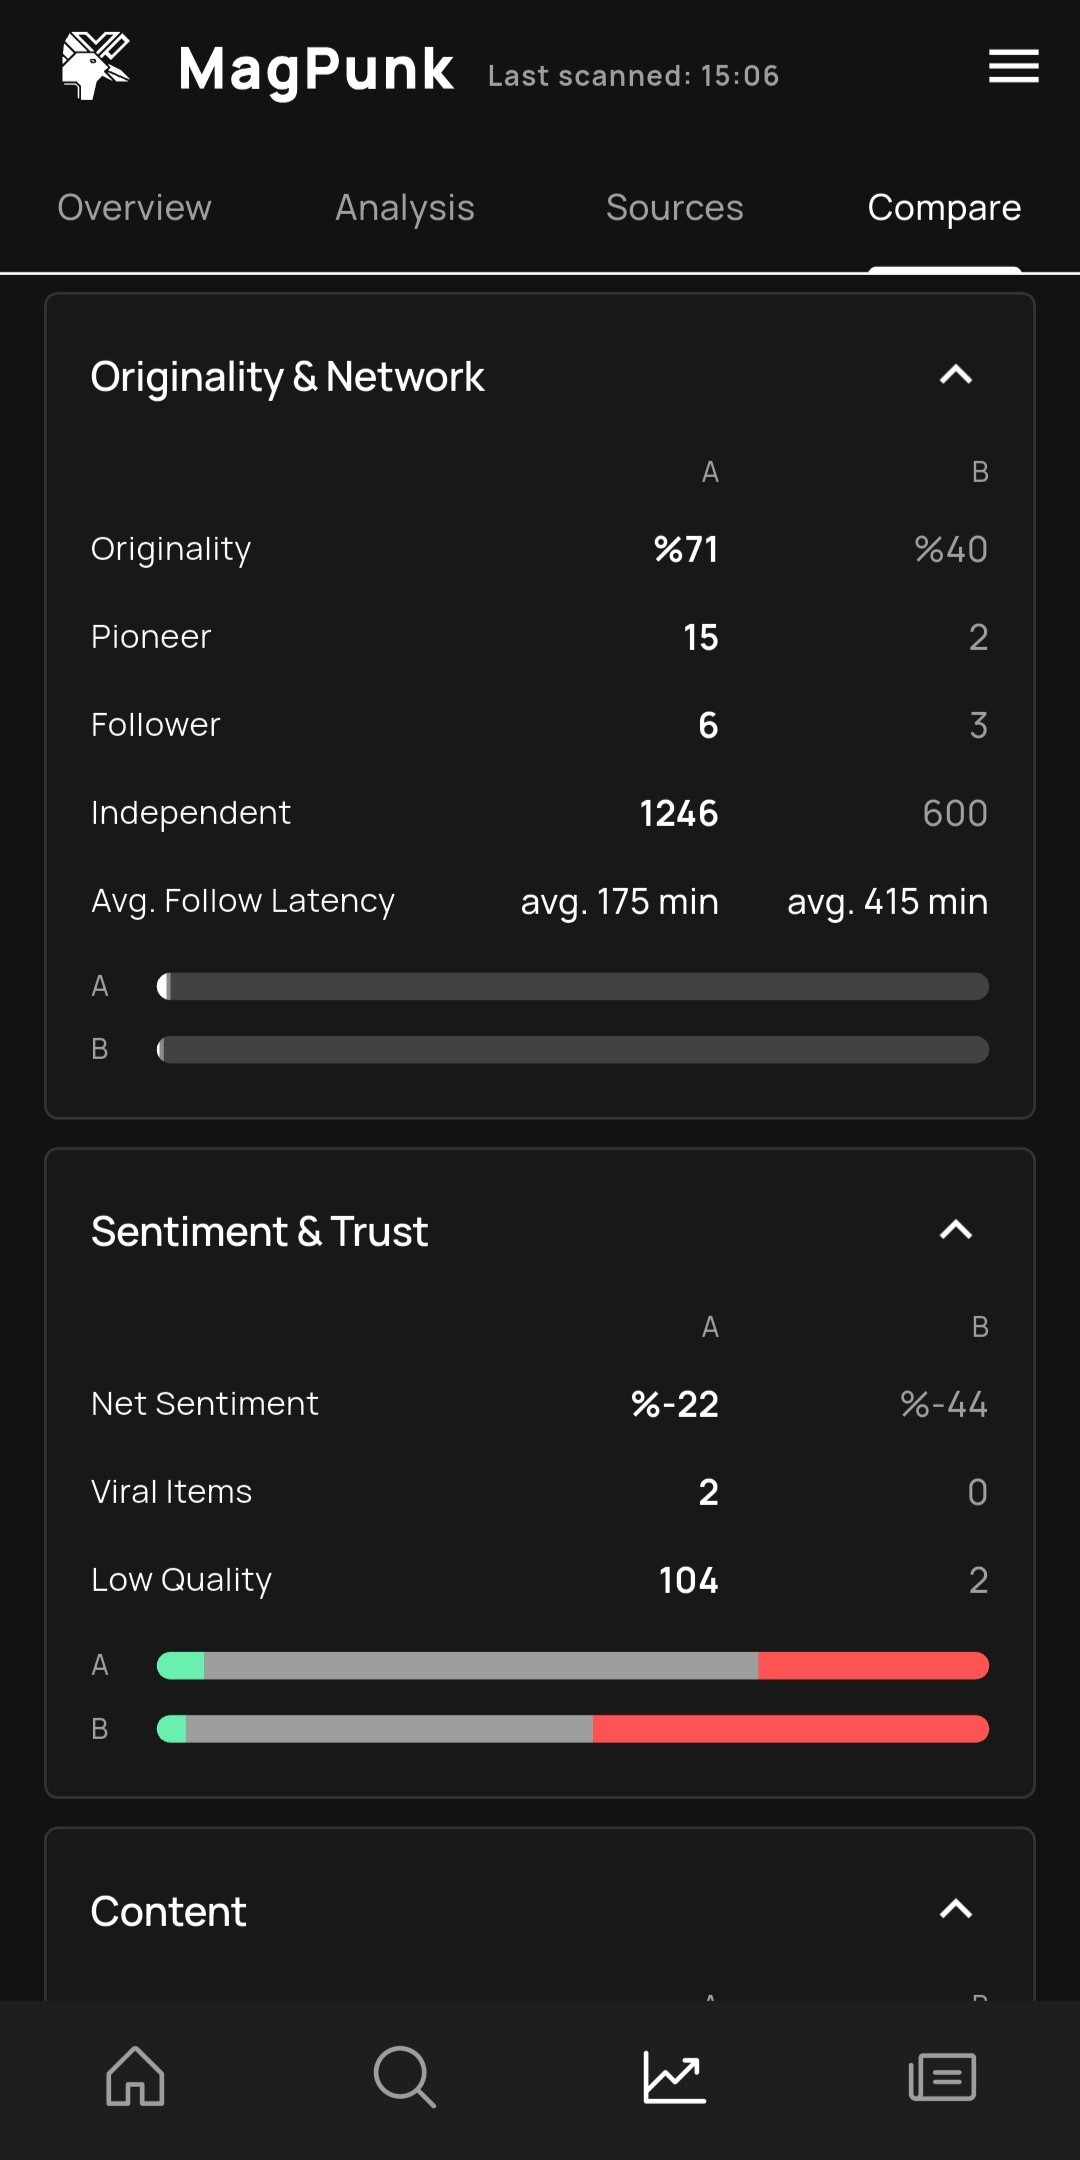
MagPunk does not secretly analyze your data in the background, it compares the news you downloaded upon your request. While you can see the overall performance of each source in the Reports tab, in the Compare tab exclusive to the Pro version, you can select two different sources and directly match their speed of giving the same news (for example, as “NTV agenda avg. 23 min behind”).
Example: Seeing side-by-side on the Compare screen how two different news channels looked at the same event, their headlines, and who broke the news first.
Go deeper
Media analyses can usually be done by companies with massive budgets or academics. MagPunk reduces this analytical power into a simple and understandable format and puts it directly at the user’s service. The tables in the Reports section are not calculated in the cloud; they are generated entirely under your control by passing the data on your device through fingerprinting operations (O(N·k) inverted index scanning along with the 3-letter words or 4-letter roots it eliminates). You can instantly compare over the reports which source produced how much content or repeated how much of it.