Welcome
Welcome
Understand MagPunk
This page does not promote MagPunk; it explains the problem MagPunk is trying to solve and the method it uses.
The page progresses in concept–response pairs. First, a concept of journalism or measurement is explained — echo chamber, gatekeeping, Jaccard similarity, precision and recall. Immediately following is MagPunk’s response to that concept.
At the very end, the things the app does not and cannot do are listed in a single block, along with measured error rates.
The goal is for you to leave having learned something, even if you don’t download the app.
23 concepts · 34 responses · 57 cards · approx. 44 minutes
If you prefer to read the whole thing on a single page instead of proceeding card by card, the Document button on the top bar provides the same content on a single printable page. You can change modes at any moment; you will stay at the heading you are on.
1.1 · Journalism Today
1.1.1News and Headline
News and Headline
News is the communication of a new event that concerns the public; the headline is the way of highlighting the most striking one among these events.
In traditional journalism, the limited page space forces editors to choose the most important event of the day. The headline is the result of this choice and directly reflects the publication’s editorial policy. By looking at the headline, the reader quickly understands what is considered critical in the world that day. In the digital environment, although the space limit is lifted, since attention is limited, the headline logic continues by changing shape.
Example: The main news given in the largest font on the front page of a newspaper is the headline.
Go deeper
Headline selection is not only a design decision but also an ideological and editorial preference. Which news will be given larger includes a guidance on what the society should talk about. While headlines change daily in traditional media, they are updated minute by minute in digital media, aiming for the reader to spend more time on the site. This constant need for updating carries the risk of prioritizing the speed and clickability of the news rather than its quality.
1.1.2New Media
New Media
It is all of the communication tools where content is produced and distributed in the digital environment, and the reader is not only a consumer but also a participant.
Unlike traditional media, new media offers two-way communication. While printed newspapers or television broadcasts provide a one-way flow of information, new media platforms center on interaction with mechanisms for commenting, sharing, and immediate reaction. This structure increases the speed of information dissemination, while also paving the way for unverified content to quickly enter circulation.
Example: Comment sections of news sites, news shares on social networks, and citizen journalism are parts of new media.
Go deeper
The most distinct feature of new media is synchronicity and hypertextuality. While reading a news item, the reader can jump to different sources through the links inside and weave their own content network. However, when this structure is combined with algorithm-supported feeds, it causes similar content to constantly fall before the user. The disappearance of physical constraints in traditional media has lowered publication costs and paved the way for independent publishing; on the other hand, low cost has also facilitated information pollution and the spread of disinformation.
1.1.3Internet Journalism
Internet Journalism
It is a continuous broadcasting model where the processes of gathering, writing, and distributing news are carried out entirely over digital networks.
Internet journalism provides an uninterrupted and continuous flow of information throughout the day by completely eliminating physical boundaries such as printing times or broadcast schedules. The ability to update news instantly allows events to be followed in real time. However, this pressure of speed makes in-depth research difficult, which is a structural problem that leads to the production of superficial texts focused solely on attracting attention.
Example: Announcing an event with a few-sentence breaking news note the moment it happens, and continuously updating the text afterwards is typical internet journalism.
Go deeper
In internet journalism, the metric of success is not circulation, but page views and visitor loyalty. This economic model pushes publishers to write click-generating headlines, create galleries, and unnecessarily chop news into pieces. Writing news according to search engine optimization (SEO) rules has led to the emergence of texts that aim to please algorithms rather than inform the reader. This inverse proportion between speed and quality is one of the most fundamental crises of modern digital journalism.
1.1.4RSS and RSS Readers
RSS and RSS Readers
It is a data feed technology that allows collecting and reading up-to-date content on websites in a standard format without entering the site.
RSS (Rich Site Summary) is a simple but powerful protocol that makes it possible to follow hundreds of different sources from a single place. Unlike algorithmic feeds, there is no content filtering or sorting in RSS readers; every published content flows chronologically. In this way, the reader decides what to see and ensures information consumption completely independent of the directions of platforms.
Example: Instead of visiting ten different news sites one by one, seeing the new headlines of all sites at the same time in an RSS reader application.
Go deeper
Although RSS usage seems to have decreased with the rise of social media platforms, it is an indispensable tool for readers who want to stay away from algorithm manipulation. While social networks offer an algorithmic feed to keep the user on the platform; RSS gives control entirely to the user. This technology, based on the principle of publishers presenting their content as an XML file, is one of the oldest and most robust ways of distributing information in a decentralized manner.
1.1.5Source Selection: Who Determines What You Read?
Source Selection: Who Determines What You Read?
It is the choice of which platforms, publications, or intermediaries to trust in order to learn about a news item or event.
In modern information consumption, the content read is generally determined not by the reader themselves, but by the algorithms of the platform used. Source selection is the filter that draws how the outside world will be perceived. If news is taken only from networks defending a single view or from a single social platform, the worldview becomes trapped within the boundaries of those sources. Diversity is the most important component of an information diet.
Example: Someone who follows only newspapers with a specific political leaning remaining completely unaware of the arguments of other views.
Go deeper
Search engines and social platforms filter content according to users’ past clicking habits. This situation causes the user to be drawn into an information bubble without realizing it. Conscious source selection is the only way to break this filter bubble effect. Following both national and international, mainstream and independent sources with different editorial policies together reduces the risk of manipulation. Leaving the control to algorithms in news reading habits means allowing the worldview to be shaped by others.
1.2 · Theoretical Framework
1.2.1Echo Chamber
Echo Chamber
It is a closed communication environment where individuals only encounter views that confirm their own thoughts and different voices are excluded.
An echo chamber is formed by social networks connecting like-minded people to increase interaction. In this environment, the same ideas are constantly repeated, creating a sense of unquestionable reality. Different views are either not seen at all or are marginalized by being made a direct target of attack and ridicule. This situation is one of the main causes of social polarization.
Example: A user who follows only people with the same political view believing that the entire country thinks the same way.
Go deeper
Echo chambers are a natural byproduct of algorithms. The main goal of a platform is to keep the user’s attention inside for as long as possible; the easiest way to do this is to present content that the user will like and that will reinforce their beliefs. Over time, this mechanism turns into filter bubbles, and the person begins to perceive opposing arguments directly as a threat rather than understanding their logic. Getting out of the echo chamber requires a conscious effort to intentionally include different views into the reading area.
1.2.1 M4: Echo Chamber / Framing
M4Examine how the same event is framed differently by different sources.
1.2.2Framing Theory
Framing Theory
It is the direction of how the reader will perceive the subject by highlighting a specific aspect of an event, rather than its entirety.
Framing is concerned with how the news is understood rather than what it tells. Even if the event remains the same, the words used, the photos chosen, and the highlighted details completely change the meaning. Calling an action a ‘protest’ or a ‘riot’ is a framing preference that directly determines the reader’s perspective on the event. This situation is the most powerful influence tool in the hands of the media.
Example: A tax increase being framed as an ‘economic measure’ in some news and as a ‘burden on the citizen’ in others.
Go deeper
News texts are never a neutral mirror; the context in which the event will be presented is always an editorial choice. Framing is done not only by word choice, but also by who is given a voice in the news, how the background information is constructed, and which consequences of the event are focused on. For example, an unemployment news item can be given as a macroeconomic statistic or it can be processed as an individual drama. Both frames create different emotional and cognitive reactions in the reader. Critical reading requires noticing which frame the event is presented from before focusing on the event itself.
1.2.3Agenda-Setting Theory
Agenda-Setting Theory
It is the approach explaining the media’s power to dictate to people not what to think, but what to think about.
An event appearing in headlines for days creates the perception that the event is the most important problem for the society. The media draws the boundaries of public discussion by deciding which news to highlight and which to ignore. The reader tends to see the topics heavily covered by the media as the main issues of the country.
Example: Despite a statistically low crime rate, the creation of a widespread feeling of insecurity in society by the media constantly reporting public order news.
Go deeper
Agenda-setting theory argues that the guiding effect of the media shapes priorities rather than directly changing opinions. When a topic finds wide coverage in news feeds, politicians and decision-makers also have to address that topic. Although this mechanism has partially shifted to algorithms and social media trends in the digital age, which headlines mainstream publishers highlight is still the main factor in guiding mass perception. A topic not being on the agenda does not mean that the topic is unimportant or resolved; it only shows that it could not cross the media’s attention threshold.
1.2.4Gatekeeping
Gatekeeping
It is the process of deciding which among millions of events will become news and which will go to the trash.
Countless events take place in the world every day, but a very small portion of these finds a place in a publication. Gatekeepers; as editors, editors-in-chief, and algorithms, filter the flow of information. This filtering process takes place in line with the priorities, political stance, and economic interests of the publication.
Example: An editor’s decision to headline a short statement by a local politician instead of news of a disaster in a distant continent.
Go deeper
In traditional media, gatekeeping was an institutional filter made by human hands. With digitalization, this role largely passed to platform algorithms. However, this does not mean filtering is over; only the identity of the gatekeepers has changed. While news sites use click potential as a threshold criterion, algorithms prioritize the probability of interaction. An event having news value is now measured by how much attention it can attract rather than how important it is. For this reason, the reader must keep in mind that the news falling before them is a very narrow selection that has passed through a wide filter.
1.2.5Clickbait
Clickbait
It is a deceptive headline technique aiming to ensure the content is clicked by intentionally provoking the reader’s curiosity with incomplete information.
Clickbait looks for the value of the news not in its content, but in the click-through rate of the headline. Instead of giving a summary of the event, an information gap is created with expressions like ‘Here is that detail’, ‘It shocked those who saw it’. The reader is forced to click the link to complete the missing information. (Note: Clickbait is the name of a concept. MagPunk’s ‘low quality’ label does not map onto it one to one: it catches measurable patterns and often misses headlines that merely leave a curiosity gap — see 2.3.3.)
Example: Giving the result of a match as ‘Surprise score in the giant derby!’ and explaining the score only in the last paragraph of the news.
Go deeper
This method is a direct result of the digital advertising model. Systems that generate revenue per page view focus on drawing the user to the site at all costs. Clickbait not only steals the reader’s time, but also devalues the content and context of the news. Although it provides a short-term interaction increase, it damages the relationship of trust between the reader and the publisher in the long run. Quality journalism is based on the principle of giving the most critical information directly in the headline instead of creating an information gap.
1.2.5 M2: Clickbait Test
M2Examine six headlines, decide if they are clickbait, and compare with the model's verdict.
1.2.6Noise (in the context of communication)
Noise (in the context of communication)
It is all of the distracting, repetitive, or low quality content that makes it difficult to reach the actual information.
In the information age, the real problem is not being unable to reach data, but sorting out what is meaningful from a massive pile of data. Noise consists of duplicate news, unverified rumors, distracting ads, and overproduced content. Too much noise makes it extremely difficult for the reader to see the signal, meaning the real and important news.
Example: An important law change getting lost among thousands of messages posted about a celebrity’s outfit on the same day.
Go deeper
On digital platforms, noise is not a design flaw, but the business model itself. The more content is produced and consumed, the more data is collected and ads are shown. This artificial content inflation strains the reader’s cognitive capacity and leads to ‘news fatigue’. The way to reduce noise is not reading more news, but reading selectively. A quality information diet requires focusing only on content that has value, is verified, and has context by filtering out unimportant and repetitive information.
1.3 · The Value of Data
1.3.1Data Privacy · case: Cambridge Analytica
Data Privacy · case: Cambridge Analytica
It is the problem of digital footprints belonging to the user being collected and used for other purposes without their consent and knowledge.
Personal data is the fuel of the digital economy. The value truly targeted in services offered for free is often the human data itself. Permissions given for a simple personality test or survey can turn into massive profiling networks in the background. This collected data is used to secretly map people’s vulnerabilities, fears, and tendencies.
Example: A seemingly innocent application secretly collecting the data of all the friends of the person who gave permission and selling it for political ad targeting.
Go deeper
The Cambridge Analytica case showed that data privacy is not just a personal problem, but a systemic crisis affecting democratic processes. In this case, the data of millions of people was collected through an academic-purpose application on a platform, and this data was used without permission to produce micro-targeted political ads that would manipulate voter behavior. Turning data into a weapon with an intention far beyond the purpose for which it was collected proves how risky the surveillance architecture of digital platforms is. Privacy is not about having nothing to hide, it is the right to be able to control who knows what.
1.3.2Backend (and the importance of its absence)
Backend (and the importance of its absence)
It is the back face of an application that is not seen by the user, processes data, stores it, and runs on remote servers.
Most modern applications use a backend, meaning a centralized server architecture. In these systems, every click made on the screen, every text read is sent to a server over the internet, processed, and recorded there. The absence of a backend architecture means that the application can work entirely on its own smoothly without exchanging any data with the outside.
Example: A cloud-based note application constantly sending the written texts to the company’s servers is an example of backend usage.
Go deeper
The presence of a central server means that data is always hosted on others’ computers. This architecture gives companies the opportunity to analyze user behavior, perform profiling, and commercialize data. Designing an application without a backend (serverless structure) means that a receiving server to accumulate data never exists. This does not mean that no request goes out: the requests initiated by the user themselves — a search, a feedback — still go out. What is guaranteed is that there is no center collecting data behind those requests. This design preference ties privacy directly to the architecture of the code, not to contracts or laws.
1.3.2 M3: The Journey of Your Data
M3Where does your data travel when you read an item? Press the button and watch the packet in both architectures.
- Your device
- Server
- Database
- Ad partner
- Your device
- Publisher's server
- Search the web — only the word you searched for, straight to the search provider. No device id, account or location.
- Feedback form — only the text you write. No IP or browser information is stored.
Neither is automatic; nothing runs until you press a button.
This diagram simplifies. The only network request MagPunk makes while you read is fetching the feed and the image; both go straight to the publisher, with no MagPunk server in between. Apart from the two exceptions above, nothing else leaves the device.
1.3.3Edge Computing (on-device computation)
Edge Computing (on-device computation)
It is the carrying out of data processing processes not on a remote cloud server, but where the data is produced, meaning directly on the user’s own device.
While data is sent to remote servers to be processed in cloud computing, heavy operations take place on the phone’s or computer’s own processor in the edge computing approach. This method prevents data from going out, minimizes latency, and eliminates the necessity for a continuous internet connection.
Example: The facial recognition process in photos being done within the phone’s own chip, not on a remote server.
Go deeper
Device hardware getting stronger over time has allowed complex algorithms, which could previously only be run on massive servers, to enter the pocket directly. Machine learning models have been compressed and made runnable on end-user devices. The consequence of this architectural change in terms of privacy is direct: as long as data does not leave the device, the risk of it being intercepted during transfer or stored on a server does not arise. Processing at the edge instead of the cloud also weakens the centralized control of giant companies and gives power back to the user’s hardware.
1.3.4Ad Algorithms (and the importance of their absence)
Ad Algorithms (and the importance of their absence)
It is the set of mathematical rules trying to show the user the most suitable ad by analyzing their interests, behaviors, and vulnerabilities.
The main goal of ad algorithms is not to inform people, but to convert all of human attention into commercial money. To keep people on the platform longer, these systems constantly highlight provocative content that often arouses anger, fear, or excessive curiosity. The value of the text is determined entirely by the probability of it being clicked, not its accuracy.
Example: After a shoe search, shoe ads constantly catching the eye on every site visited.
Go deeper
An ad-supported platform sees the user not as its customer, but as a product to be sold to the advertiser. This model deeply damages the independence of the news. Tracking codes embedded inside applications lead to continuous profiling of personal preferences. An environment free of ad algorithms makes it possible to work only human-focused, without an external motivation. In a design where attention is not sold, there is structurally no need for biased highlighting of content or encouraging provocative headlines.
1.3.5Staying Offline
Staying Offline
It is the ability of the software to continue fulfilling its core functions without missing anything even when the internet connection is lost.
Almost all modern applications continuously demand an uninterrupted internet connection. However, text-based data can easily be downloaded to the device beforehand. Being able to work offline is an extremely vital feature that always secures access to information even in extraordinary situations where there is no internet reception or it is censored.
Example: News headlines downloaded before getting on the subway being readable and analyzable even without an internet connection.
Go deeper
The necessity to stay online constantly is often a requirement for data collection and instant ad display rather than a technical need. Software designed with a local-first approach stores data on the device and uses the internet only as a bridge for synchronization. While this architecture provides speed and continuity to the user, it also represents taking a step away from the surveillance economy.
1.4 · Evaluation and Measurement
1.4.1Jaccard Similarity
Jaccard Similarity
Jaccard similarity is the ratio of the common items of two sets to the total of distinct items in those two sets.
Two titles are first converted into a set of words. The number of common words is divided by the total of distinct words appearing in the two sets. The result is a number between 0 and 1: 0 means no common words at all, 1 means the two sets are exactly the same. The measurement does not look at the order of the words, it only looks at which words are present. Its calculation is cheap; it can be run among thousands of titles.
Example: In the
{earthquake, region, damage}and{earthquake, region, team}sets, the common word count is 2, the total distinct word count is 4. Jaccard = 2 / 4 = 0.50.
Go deeper
Formula: J(A,B) = |A∩B| / |A∪B|.
Since the measurement runs on sets, word order and repetition count do not change the result. “Earthquake in region” and “In region earthquake” yield the same set.
It has two known limits. First: two titles telling the same event with completely different words receive a low ratio — the measurement sees the word, not the meaning. Second: conjunction and preposition type words appearing in every text artificially raise the ratio. The second problem is reduced by eliminating these words (stopwords) and very short words before comparison. The first one cannot be solved with this method; it is an accepted limit.
In a naive implementation, every title is compared with every title and the cost grows with the square of the item count. An inverted index — taking as candidates only pairs carrying a common word — reduces this cost.
1.4.1 M1: Similarity Lab
M1Test the limits of the Jaccard measure. Does word order change the result? What do stop words do?
1.4.2Classical ML (Machine Learning)
Classical ML (Machine Learning)
They are software models that make predictions by extracting statistical patterns over large datasets, learning the rules from data instead of humans.
Classical machine learning does not understand text or context like humans at all. Instead, it makes linear probability calculations by converting the frequencies of words and letters into mathematical weights. For this reason, although it cannot resolve implicit subtle ironies, it can detect certain patterns within its statistical limits.
Example: A model of approximately 7 MB in size running on the device making a prediction just by looking at the word frequencies in the title without reading the body of a news item.
Go deeper
Machine learning models prevent overfitting with techniques like L2 normalization. Text data; consisting of letters and words, is converted into a space (with TF, IDF formulas) generally having around 16,000 (8,000+8,000) dimensions. Weights are adjusted with optimization methods like L-BFGS. In the stage where the model produces output, the summed word weights pass through a decision function (sigmoid) and are converted into a probability value. This statistical approach is transparent; why the model made that decision can easily be explained by looking at the mathematical contribution of each word.
1.4.3Precision, Recall and Threshold (P / R / F1)
Precision, Recall and Threshold (P / R / F1)
They are the metrics that measure the success of a detection system; they express the balance between how few errors are made (precision) and how many of the targets can be found (recall).
Precision is the rate of the system being right when it says ‘this is so’. Recall is how many of the ones that are truly so it can find. The threshold value is the balance point between these two. While fewer but more accurate results are obtained when the threshold is raised, mistakes begin to mix in when the threshold is lowered.
Example: In a spam filter, if precision is high, real emails never fall into spam. If recall is high, no spam escapes.
Go deeper
In data analysis, the threshold value is never a fixed number (for example, z ≥ 0.5, which is merely an example); it is selected from the data according to the structure of the problem. By aiming for a high precision floor (e.g. 0.90 or 0.80) and automatically selecting the threshold, the system’s margin of error can be minimized, but in this case, the recall rate drops. The F1 score is the harmonic mean of these two values and shows the overall performance of the system. For instance, if P: 0.99, R: 0.61, and F1: 0.75 is achieved on low quality Turkish items measured on a real feed with a natural distribution, this means the system very rarely errs but can catch only a portion of the low quality ones.
1.5 · Analysis of the Media
1.5.1Media Sentiment Index
Media Sentiment Index
It is the mathematical calculation of the general tone created by the words used in news texts as positive, negative, or neutral.
How an event is exactly presented to the outside is completely directly related to the word choices and writing style passing in the text. Sentiment analysis successfully and quickly measures the overall atmosphere of the news by mathematically summing up the emotional loads carried individually by the words in the text. This calculation aims to show the statistical tone of the words at a basic level.
Example: A headline containing ‘crisis’, ‘collapse’, ‘disaster’ statistically giving a highly negative tone.
Go deeper
The sentiment index is used to understand through which lens a publication looks at events. When it is done with rule-based dictionaries instead of machine learning, the results become more transparent. It can resolve simple structures by changing the weight of words before and after contrast conjunctions (but, however). However, this method cannot perceive irony, sarcasm, or implicit messages. For this reason, sentiment analysis should be considered not as a definitive truth, but as a useful compass showing the general atmosphere created by the media.
1.5.1 M5: Sentiment Index
M5Shows how to read the spread behind a single daily average.
1.5.2Speed, Trend and Viral in Media
Speed, Trend and Viral in Media
It is the dynamics of a topic exploding simultaneously across multiple sources, spreading rapidly, and entering circulation.
In digital media, short-lived passing trends are generally followed much more than fundamental events. A news item being copied quickly and spreading with great speed (becoming viral) without hitting any obstacles shows only its surface attractiveness, not its structural importance. When topics become a trend, the feed changes completely.
Example: A celebrity statement being given as breaking news with the exact same sentences across all platforms within 3 hours.
Go deeper
In journalism, speed is the biggest enemy that disables verification mechanisms. A word appearing in many different sources in a short time makes it a trend. Systems can track this speed mathematically by producing different scorings (+7, +4, +2 like trend bonuses) based on the age of the items. However, rapidly spreading viral content is mostly superficial. Items satisfying the viral condition in algorithmic tracking are a meaningful indicator for understanding mass psychology rather than information value.
1.5.3Content Density in Media
Content Density in Media
It is the volume taken up in the feed by duplicate news produced on the same topic, mostly with the same words.
When an event takes place, different publishers constantly using agency texts exactly by copying them instead of doing their own original research creates a massive content density. This annoying situation persistently causes the different headlines that constantly appear before people to actually be copies fed from a single source.
Example: Ten sites, thought to have different views, publishing a text consisting of the exact same words by copying it.
Go deeper
The low cost of digital publishing encourages multiplying content rather than producing content. Content density is information inflation. The copy-paste method taking the place of original journalistic activity causes the disappearance of different perspectives. Algorithmic analyses can filter information repetition by detecting these repetition clusters, but the root of the problem lies in the economic model of the media. This structure, where quantity is rewarded over quality, exposes the reader not to new information, but to noise.
1.5.4Bias, Neutrality and Objectivity — and the limit of measuring them
Bias, Neutrality and Objectivity — and the limit of measuring them
It is the worldview (bias) of the publication, its effort to remain impartial while conveying events (neutrality), and its goal to present the truth without bending it (objectivity).
These concepts are very clearly the most fundamental and complex natural elements of human communication. No text can be wholly impartial because even which word is carefully chosen reflects a hidden ideological bias. It is not feasible for software to fully formulate these deep human concepts.
Example: The human interpretation in presenting the same event as a ‘struggle for freedom’ in one newspaper and a ‘security threat’ in another.
Go deeper
Algorithms can count words, find matches, and extract a statistical tone; but they cannot know what the truth is. It is misleading for a piece of software to claim that it measures the subtleties in human behavior or the truth. Traditional research methods require deep human comprehension and sociological background. Statistical methods can only catch certain surface patterns, they cannot decipher the ideological subtext behind the event. For this reason, knowing the limits of software tools, it is mandatory to stop blindly trusting them and to always keep critical human intellect as the final decision-maker.
2.1 · Core Stance
2.1.1Has No Server — No Account, No Login
Has No Server — No Account, No Login
MagPunk has no central server; your data is not stored or processed on a remote computer.
The moment you download the app, everything starts working. You do not need to provide an email address, set a password, or open an account. All your settings, reading history, and favorites are kept securely directly in your phone’s storage. This architecture structurally prevents your personal data from being transferred to another company’s servers.
Example: Putting your phone in airplane mode and opening the app to see your saved data load completely.
Go deeper
Most modern news apps are cloud-based (they use a backend); meaning your usage metrics like which news you clicked on and how long you read it are transmitted instantly to a remote server. MagPunk rejects this structure entirely. Thanks to its backend-free architecture, there is no database around to be hacked or sold to advertisers. You are directly the sole owner and keeper of your data.
2.1.2Everything is Calculated on Your Device
Everything is Calculated on Your Device
Heavy operations like analyzing and labeling news are done not in the cloud, but on your phone’s own processor (edge computing).
Instead of sending news titles to a remote server and waiting for the result, MagPunk uses small-sized analysis models integrated into your device. The moment you download a news headline, your phone scans this data internally, performs the calculations, and prints the result on the screen. This prevents unnecessary data sharing with the outside.
Example: The Critical label being given by your phone’s own processor without a response coming from an external server.
Go deeper
Edge computing is the model where privacy is protected at the highest level. The classifiers inside MagPunk are designed not to exhaust your hardware resources. Every news item downloaded to your device is evaluated only on your hardware. Thanks to this structure, your usage habits cannot be profiled; the possibility of third parties tracking your behavior is eliminated with a structural decision.
2.1.3No Popularity Signal and No Ads
No Popularity Signal and No Ads
Items are highlighted not according to how much they are clicked or how much ad revenue they will bring, but solely based on their information value.
There are no ad spaces or sponsored content inside the app. MagPunk does not see user behavior-based popularity signals like ‘most read’ or ‘trending’ as a determining factor in the feed. The system evaluates only the news itself according to its statistical rules, so your attention is not sold to provocative content or ads.
Example: A news item scoring solely based on the information value it carries in the MagPunk feed, even if it is clicked millions of times on social media.
Go deeper
Ad-supported models aim to keep the user on the platform for longer and therefore create echo chambers. In MagPunk’s business model, there is no user attention to be sold to an advertiser. The app does not collect or show data about which content is popular. This design structurally prevents sensational or clickbait items from getting ahead of other valuable news simply because they are popular.
2.1.4Works Even When You Have No Internet
Works Even When You Have No Internet
Since data is kept on your device, you maintain full access to the items you have previously downloaded even when your internet connection is lost.
When you open the app, the current feed downloads to your phone. Later, when you get on the subway or pass into a region with no internet reception, you seamlessly continue reading all the downloaded titles, summaries, and analysis labels. The internet is only used to pull new data, it is not required for the app to function.
Example: Being able to read news summaries and see their labels in the feed even after turning off your internet connection.
Go deeper
The local-first approach grants the user uninterrupted access even under extraordinary conditions. The moment possible bandwidth throttling or connection losses happen, the data you have remains usable. Unlike cloud-based applications, you do not just face an error screen when you are offline; all the analysis power and filters of the app continue to operate at full capacity on the downloaded texts.
2.1.5The Source List is Yours — The 435-Source Catalog is a Start
The Source List is Yours — The 435-Source Catalog is a Start
In MagPunk, it is not algorithms but entirely you who determines what to read; you are only presented with a curated starting point.
There is a ready-made catalog of 435 sources inside the app, but this is not a ranking of quality. You create a wholly personal reading list by selecting what you want from this catalog or by adding your own favorite sources that are not on the list. Algorithms cannot secretly put any source you did not select in front of you.
Example: Adding the address of a local newspaper not featured in the catalog and being able to read only the news of that newspaper.
Go deeper
Source selection is one of the most important filters of your information diet. The 435-source catalog in MagPunk is a starting set compiled from sites whose RSS infrastructure works properly and that meet minimum publishing standards (e.g., being updated regularly), and it is constantly maintained. However, this set is not a definitive truth. You can include all the external links you want in the list. The Smart Discovery feature makes it extremely easy to add the feed (RSS) links at the address you enter to the list by finding them for you.
2.1.6Inventory of Data: What is Kept, Where Does It Go
Inventory of Data: What is Kept, Where Does It Go
It is the full list showing clearly what data of yours stays where, how long it is stored, and under what circumstances it leaves the device.
Your reading habits never leave the device. When you use the feedback form, it (only the text you write) is sent voluntarily. The only exception that goes out of the device is the ‘Search web’ function; and this does not run automatically, it only transmits the searched word directly to the provider. No data indicating who you are is collected.
Example: Not a single request going automatically even to the search engine unless you press a button.
Go deeper
How long the items will stay on the device is determined from the settings. For periods like 3, 5, 7 days, the item ceiling is 50; for 14 days it is 100; for the 30 days and unlimited options the ceiling is 200 items (these ceilings are applied by half for feeds without date information). The ‘Search web’ exception has four guarantees: 1) It only works when the button is pressed, it is not automatic. 2) Only the searched word goes; the device ID or location does not go. 3) The request goes directly to the provider, there is no MagPunk server in between. 4) If the endpoints cannot be reached, offline suggestions continue to work.
2.2 · How It Builds the Feed
2.2.1Score Instead of Chronology (10–100)
Score Instead of Chronology (10–100)
It is the ranking of news not from newest to oldest, but according to an information value score between 10 and 100.
A continuously flowing chronological list causes the news that is actually unimportant but entered most recently to appear at the very top. MagPunk sorts the feed not by time order, but by the score of the news. Thus, a valuable item entered a few hours ago does not get buried under an unimportant item entered just now.
Example: A tabloid news item entered five minutes ago staying at the bottom with a score of 20, while a news item from two hours ago with a score of 85 stays at the top.
Go deeper
The score range is in the 10-100 band. A score of 99 is the mathematical ceiling an uncritical item can receive; a score of 100 is reserved only for the most important news that truly received the ‘critical’ label. The base score starts from 60 and then additions or subtractions are made according to the qualities of the item (such as being a headline, appearing in multiple sources). In this way, the news presented to the reader’s attention is placed into a calculated hierarchy of value rather than a chronological noise.

2.2.2What Raises the Score, What Lowers It
What Raises the Score, What Lowers It
It is by what mathematical rules the score, starting from the base score, changes according to the qualities of the news (headline, authority, quality).
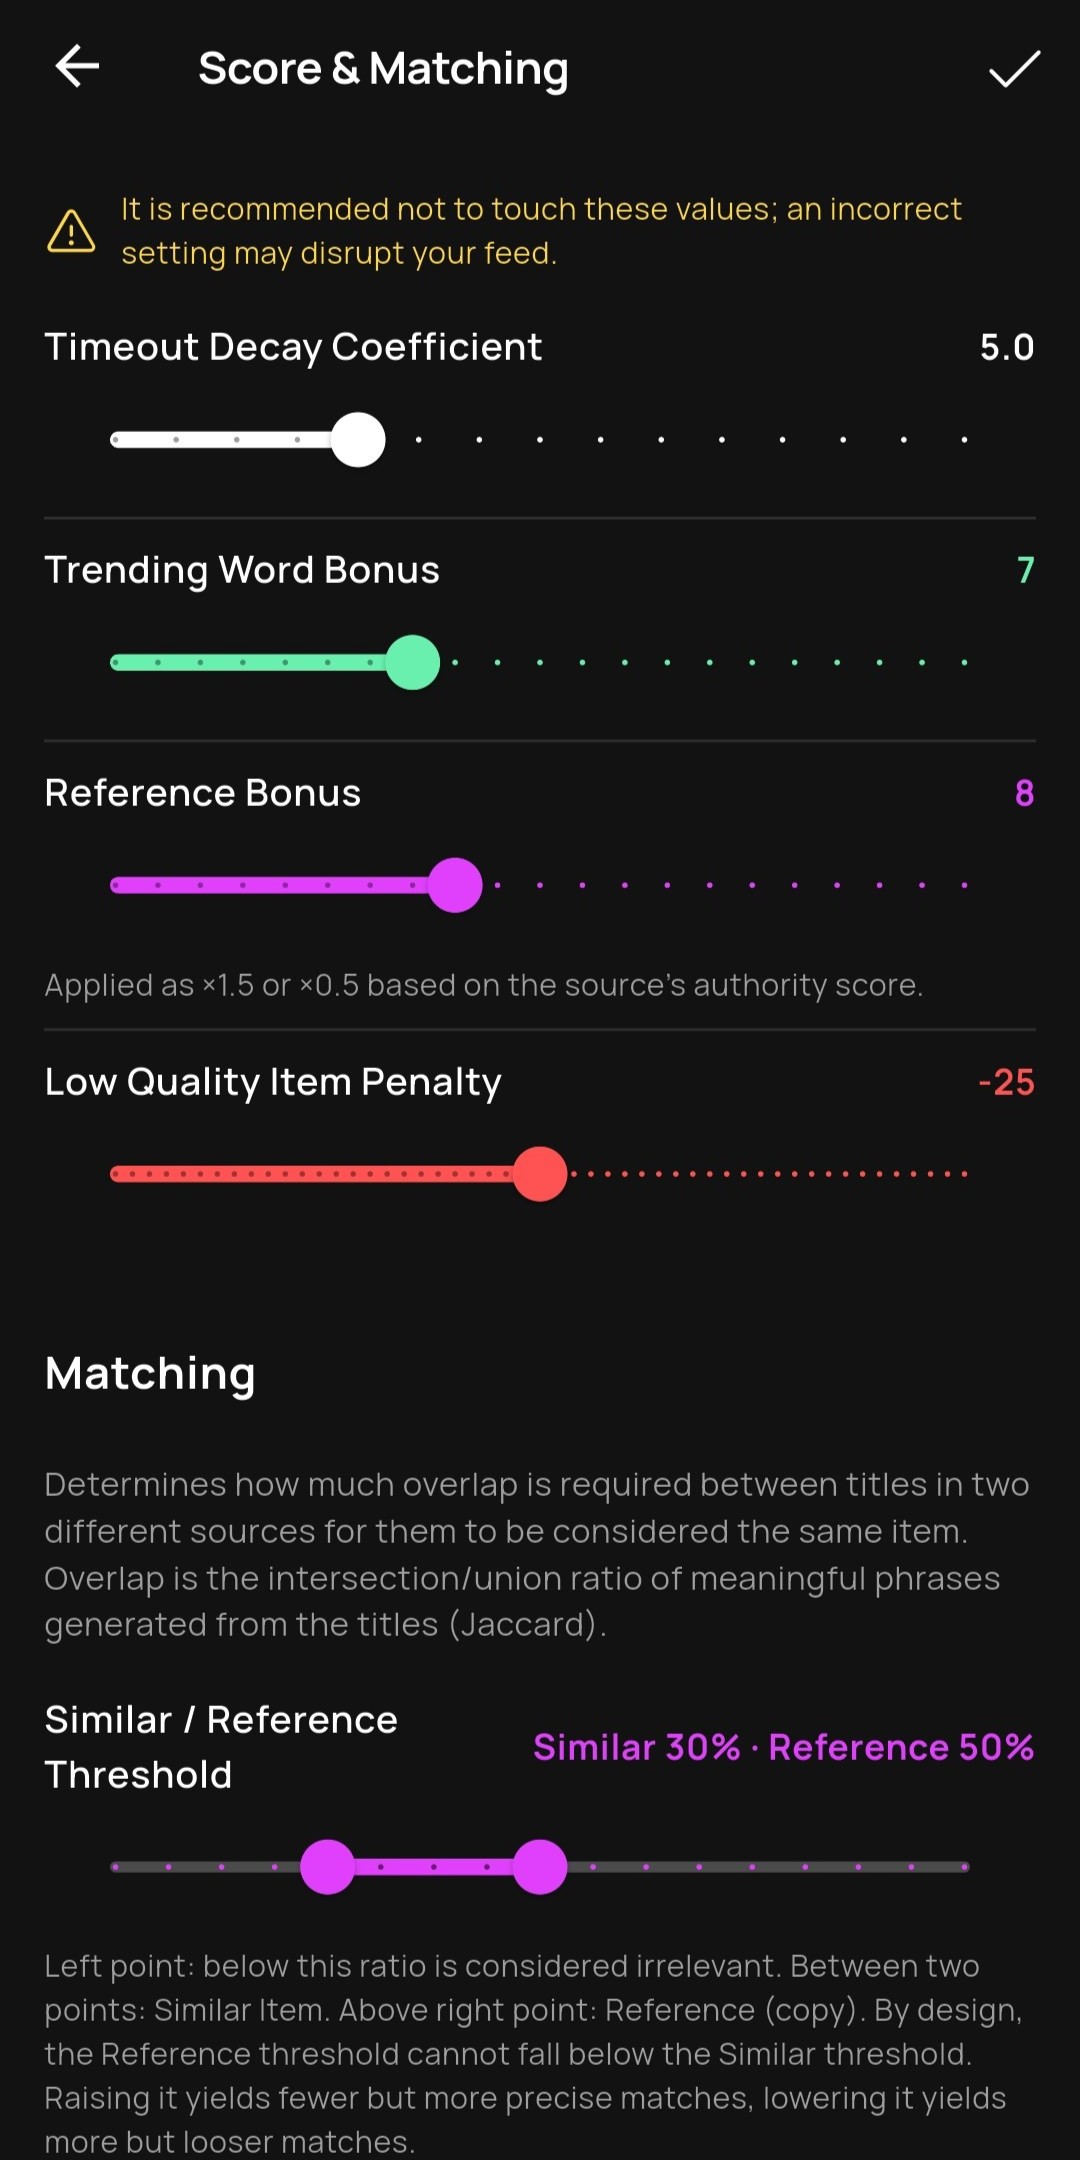
The score starts with a base score of 60. If the news is a headline it receives +10 points, if it is not a headline it receives minus points according to its scan order (order×2). The news being covered in a large number of sources brings a +(8 × authority) contribution, while being a low-quality item (for example, clickbait) brings a -25 penalty point.
Example: The score of a news item that is a headline (+10) but is labeled low quality (-25) dropping from 60 to 45.
Go deeper
The scoring system is not a secret algorithm, but an open mechanism whose rules are clear from the start. Trending words contribute directly to the score (at most 3 words); a newly exploded trending word brings a +7 bonus, while an older trending word brings +4 or +2. Thus, the upper limit of the trend bonus is roughly around +21 points. However, items with only similarities get a +(3 × authority) contribution or those that have very few sources and benefit from equal opportunity (+8) also increase their scores. You know exactly what affects the score.
2.2.3Decay: No Title is Permanent
Decay: No Title is Permanent
No matter how high the score of the news is, it is the gradual dropping of this score with a statistical formula as time passes and the news moving down in the feed.
Information gets old over time. A very important news item with a score of 90 should not still sit at the very top hours after it went on air. The decay function gradually pulls the scores between 10 and 99 downwards over time. Critical items (operates in the 10-100 range) start at the very top but decay at the same speed; their privilege is their starting point, not durability. The badge stays for 3 hours; but the score does not freeze, it decays from the first moment.
Example: A news item that was at the top with a score of 90 in the morning decaying and moving further down towards the evening hours.
Go deeper
The decay operation is calculated with an exponential formula in the form of e^(-rate×age). This mathematical approach ensures that news dampens naturally instead of disappearing suddenly from the feed. The dampening speed is the same for all items. The difference of critical items is that they start decaying from the highest peak point (100); so they can find a place in the upper ranks of the feed for a longer time.
2.2.4Equal Opportunity: Narrow Interests Are Not Crushed
Equal Opportunity: Narrow Interests Are Not Crushed
It is the supporting of niche (special interest) news that might get lost in the density of mainstream media with extra points if there are few sources in its category.
A news item coming from just a single local newspaper is normally crushed against a mainstream news item transmitted by hundreds of agencies. MagPunk gives a +8 equal opportunity score to that item if the item is not multi-sourced and there are less than 3 sources in its category (for example, science or local news). Thus, minority voices preserve their visibility.
Example: An important article coming from a single technology magazine being able to climb to the top ranks among hundreds of politics news items.
Go deeper
Content density in the media causes popular topics to take over the entire feed. If the number of publishers in a category is small, the competition chance of that category drops. The equal opportunity rule (items that are not multi-sourced and categories with <3 sources) balances independent publications or niche areas that are on the verge of disappearing within the noise of mainstream media with a mathematical intervention. Thus, the reader finds the chance to see not only what everyone is talking about, but also the valuable items in the special areas they follow.
2.2.5Thresholds Are in Your Hands — Your Own Gatekeeper
Thresholds Are in Your Hands — Your Own Gatekeeper
It is being able to set the limit values yourself that determine the difficulty level of the items that will enter the feed, that is, showing what proportion of doubt will be accepted.
MagPunk does not impose fixed rules on you. You can adjust the overlap and similarity thresholds, the decay speed, the low quality penalty, and the reference and trend contribution. If you raise the threshold, the system makes fewer mistakes but might miss some items (high precision, low recall); if you lower it, it catches more items but wrong predictions might mix in.
Example: Choosing to get notifications only for truly massive events by setting the notification score threshold very high.
Go deeper
Every analysis model produces statistical probabilities; the line determining where this probability will turn into a decision is called a threshold. For ML labels (low quality or critical), thresholds are selected automatically during training by using precision floors like 0.90 or 0.80, you cannot intervene in these. However, you can play with the thresholds open to user adjustment (overlap, etc.). There are logical limits in these settings; for example, the reference threshold cannot be lowered below the similarity threshold. Being able to manage thresholds is an extremely powerful feature that takes the control of the algorithm out of the developer’s hands and gives it directly into the user’s hands.
2.3 · How It Reads Content
2.3.1On-Device Classifier
On-Device Classifier
It is the built-in classical machine learning system of about 7 MB in size that measures the quality, criticality, and sentiment of the news on your device.
Instead of using massive models in the cloud, MagPunk runs small-sized (≈7 MB) classical machine learning algorithms integrated into your device. Trained with L2 normalization in a space consisting of letters and words with around 16,000 (8,000 + 8,000) dimensions, this lightweight model rapidly calculates the statistical tone of every news item that comes to you.
Example: Your phone being able to calculate the negative word density in the news within seconds even when you have no internet.
Go deeper
This model was trained on thousands of titles taken from the real feed (the training set in version v1.0.0 consists of 42,362 titles, and 85% of this, 36,002 data points, are used for training, while 15%, 6,360 data points, are used as the held-out test; seed=42 was used for deterministic splitting in the model). The operation of the model on the device is completely transparent: The model calculates word weights with the formulas TF = 1 + ln(occurrence) and IDF = ln((1+N)/(1+df)) + 1. It is trained with the L-BFGS method with a maximum of 2000 iterations. The decision mechanism turns into a probability by entering the sigmoid function over z = b + Σ(wᵢ·xᵢ).
2.3.2Critical Label and Three-Hour Badge
Critical Label and Three-Hour Badge
It is the high importance mark given to disasters, wars, or very vital policy changes that could deeply affect society.
The critical label prevents the most vital news in the feed from getting lost. These items go above the standard 99 ceiling and directly receive 100 points. A news item with a critical label is displayed in your app with a protected badge for 3 hours. A critical item starts at the very top but decays at the same speed; its privilege is its starting point, not durability.
Example: A major earthquake news item being published with a red critical label and carrying a badge for three hours.
Go deeper
The probability of encountering critical news in the real feed is only around 4-5%. To be able to detect this rare situation, a balanced weight system was applied during model training by increasing the weight of the rare class by approximately 10 times. The critical badge disappears at the end of 3 hours. The score, however, does not freeze at any point: it decays at the same speed as other items from the first moment and drops to around 97 in 40 minutes. Still, since it starts from 100, it stays above an ordinary item of the same age; the temporary noise during the day does not bury a vital development.
2.3.3Low Quality Label
Low Quality Label
It is the system that recognises content of low information value by the measurable patterns it carries, and marks it.
The label reads the form of a headline, not its intent: listicle and service headlines (‘7 practical methods’), horoscope, fortune-telling and dream-interpretation content, and question patterns such as ‘who is’, ‘when is’. Content that receives the label instantly loses -25 penalty points from its score. The machine learning model has an F1: 0.75 in low quality TR detection, while the rule engine has an F1: 0.41 success by looking at specific phrases (‘ne zaman’, ‘kimdir’ etc.) or question mark patterns (2 or more ‘?’).
Headlines that carry no such pattern and merely leave a curiosity gap mostly do not get this label. A headline like ‘Here is that detail’ or ‘It shocked those who saw it’ steals the reader’s time just the same, but leaves no measurable trace; the system cannot see it.
Example: The headline ‘What does it mean to dream about water?’ receiving the low quality label — while ‘Here is that development concerning millions!’ does not.
Go deeper
The main goal of the low quality label is to push the content trying to steal the reader’s time to the bottom of the feed. In English low quality detection, the ML model’s success (F1: 0.55) is behind the Turkish model. The rule-based backup engine achieves an F1: 0.60 success by looking at lists starting with numbers or patterns like ‘how to’ / ‘guide to’ in English. While the recall rate provided by the ML model for low quality TR here is at a reasonable level like 0.61, the essential thing is keeping the precision (P: 0.99) very high in order to prevent the reader’s time from being wasted.
2.3.4Sentiment and Status Quo Test
Sentiment and Status Quo Test
It is the system that does not look at whether words are individually positive or negative, but what the action in the content changes compared to the situation yesterday.
Sentiment analysis does not look at word tones; it gives a negative decision if there is a new harm, positive if a harm is ending, and neutral (status quo) if the wheel turns and there is no clear result. For this reason, contrasting situations containing the same words are successfully separated.
Example: The title ‘A theft occurred’ separating as negative, while the title ‘The thief was caught’ separating as positive.
Go deeper
If the primary ML model fails to load, the rule engine kicks in for sentiment detection. This backup system performs dictionary scoring between -3 and +3 (342 negative, 284 positive words for TR). When it sees contrast conjunctions, it multiplies the weight before it by ×0.4 and the weight after it by ×0.6. While scoring, the density divisor is taken as ‘max(word count, 5)’ and the decision threshold is around ±0.25. However, the system cannot measure irony or a hidden bias (neutrality) within the context.
2.3.5Political Neutrality Rule
Political Neutrality Rule
It is the classification model intentionally avoiding labeling statements supporting or opposing a specific political figure, party, or ideology.
The goal of MagPunk is not to say that a news item is politically right or wrong. The model does not take sides in political texts and does not make implications like ‘this news is biased’ or ‘this news is objective’. The app’s job is solely to make technical (low quality) or statistical (negative) measurements.
Example: The model not stamping an ideological label even though newspapers with two different views present the same political news differently.
Go deeper
By its nature, partisanship in political texts is highly open to interpretation. The reason MagPunk adopts this constraint is that it is impossible to fact-check political debates. The goal of the app is not to answer the question ‘who is right’, but to measure information structurally. Whether the political statement in a news item is provocative can only be weighed by the reader themselves with their critical mind. MagPunk firmly refuses to assume the role of referee in this debate.
2.3.6“Why This Label?” — Explainability
“Why This Label?” — Explainability
It is the transparency screen showing exactly with the contribution of which word the machine learning model on your device gave that label to a news item.
When the system assigns a label, there is no black box behind it. When you press the ‘Why this label?’ button, you clearly see from which word the model received how many points while making that decision. As a requirement of the transparency invariant; the sum of the mathematical contributions of the words and the base value of the system (Σ(word contribution) + base = score) is always equal to the final score of the label.
Example: Seeing transparently on the screen that the word ‘earthquake’ in a headline provided a direct contribution of +0.42 points to the model.
Go deeper
Most modern deep learning systems hide their decisions behind inexplicable massive matrices. The lightweight (≈7 MB) classical classifier in MagPunk, on the other hand, is wholly explainable due to its linear features. This feature allows the user to question the algorithm’s decisions. Being able to see how the algorithm thinks (or how it errs) is the most effective way to keep in mind that they are statistical prediction tools, instead of blindly trusting artificial systems.
2.3.6 M6: Why This Label?
M6See how words contribute to the verdict score.
2.3.7Rule Engine: Fallback System if the Model Fails to Load
Rule Engine: Fallback System if the Model Fails to Load
It is the backup and open dictionary-based system that kicks in if the machine learning (ML) model cannot be loaded.
This engine is only a fuse; if the ML model is loaded it does not run at all. The two do not run simultaneously and contradict each other. The rule engine does not use complex math; it looks directly at word lists, strict logical conditions (like having consecutive question marks in the title), or dictionary scoring.
Example: When the model file fails to load for any reason, the rule engine kicking in and continuing to classify the news at a basic level.
Go deeper
The Rule Engine is a seatbelt, but its success rates are markedly lower compared to the ML model. For instance, while the ML model shows a success of ≈0.66 (F1) in the Critical TR label, the rule engine stays at only ≈0.30. In fact, the rule engine got 0.00 in all values on the Critical EN row. However, it provides a useful verification in Sentiment Neutral detection with its Turkish (F1: 0.74) and English (F1: 0.66) results. The reason for the engine’s existence is not high accuracy, but ensuring the app is not left without labels when the model fails to load.
2.4 · How It Measures Sources
2.4.1Fingerprint and Jaccard Comparison
Fingerprint and Jaccard Comparison
MagPunk reduces each title to a set of phrases and compares these sets with the Jaccard ratio to find items telling the same event.
The title is first simplified: converted to lowercase, apostrophes and suffixes are deleted, punctuation is discarded (Turkish letters are preserved), standalone numbers and words shorter than three letters are eliminated. The root of the remaining words is taken; stopwords and roots shorter than four letters are weeded out. One, two, and three-word phrases are extracted from what remains. This set of phrases is the fingerprint of the title.
Example: If the Jaccard ratio is 50% and above, two items are considered reference, if it is between 30-49% they are considered similar, if it is below 30% they are considered unrelated.
Go deeper
The comparison is not made without satisfying four mandatory conditions: the language of the two items must be the same, their source different, their link different, and the age difference between them must be less than 24 hours. These conditions keep the repetition of the same source’s own content and random matches across days out of the pool.
Instead of comparing every title with every title, an inverted index is used: only pairs carrying at least one common phrase become candidates. The cost drops to around the O(N·k) level instead of O(N²).
Both thresholds can also be changed from Settings. The only constraint is this: the reference threshold cannot be lowered below the similar threshold — if it could be lowered, the “similar” range would close, and the two labels would be identical.
The reference label is not an accusation of plagiarism. What is measured is the word overlap of two titles; two publications using the same agency bulletin also receive a high ratio. The label allows you to see in how many sources and in what order an event appeared; it does not pass judgment on the source.
2.4.2Reference, Similar, Unrelated
Reference, Similar, Unrelated
It is the similarity grading showing how much two news texts overlap over their words and semantic roots.
The system matches the news with each other by taking their fingerprints. If similarity is ≥ 50% the content is considered reference, if between 30-49% similar, if < 30% unrelated. The reference label is not an accusation of copying or plagiarism; high-quality publications that use the same official agency text and process the topic with exactly the same words naturally receive high similarity too.
Example: All of them being linked to each other as references upon a statement made by the Ministry being published with the same words on ten different sites.
Go deeper
For the comparison operation to be done efficiently, the system uses an inverted index architecture (O(N²) → ~O(N·k)) and this process takes place depending on 4 mandatory conditions. In matchings, conjunctions shorter than three letters or very short words are eliminated; the length of the eliminated word in the fingerprint is 3, while the root length is 4. The comparison window is limited to ≤ 24 hours; meaning only events within one day are connected to each other. As per system rules, the reference threshold can never be lowered below the similar threshold. All these operations take place on the device’s own hardware.
2.4.3Pioneer or Follower? (Authority Multiplier)
Pioneer or Follower? (Authority Multiplier)
It is the authority multiplier calculated in a 3-day window determining whether a source is generally the first to break the news or gives the news later.
If your publication time is always the earliest among all references of a news item in the same group, the source gains authority. In the authority window of the last 3 days, if the source’s first publication rate is ≥60%, it receives the PIONEER (1.5× authority multiplier) label, if <30%, the FOLLOWER (0.5× authority multiplier) label. If there is not enough data in the system (less than 3 items), the multiplier is fixed at 1.0×.
Example: A news site grabbing the ‘Pioneer’ multiplier by being the source that always announces an event first within the last three days.
Go deeper
This authority mechanism separates sites that exist merely by using agency bulletins from sites that break the news first by showing their own editorial reflex. Pioneer sources get the chance to directly stand out in the feed thanks to the 1.5× authority multiplier. Followers, on the other hand, drop their multiplier by taking a 0.5× authority multiplier due to their publication times. This structure is a simple and effective way to mathematically reward the journalism that truly researches and breaks the news first within the system.
2.4.4Viral: The Arithmetic of Spread Speed
Viral: The Arithmetic of Spread Speed
It is the spreading label indicating a news item exploding simultaneously across multiple independent sources within a short time.
The viral label measures not the importance of the event but how fast it spreads. To earn the viral badge, the item’s age must be ≤ 3 hours and it must have at least one reference and two similar (or at least two reference and one similar) connections. This label allows you to see the momentary storms in the feed and stays on the item card for 4 hours.
Example: The item receiving the viral badge upon a statement made by a famous actor making headlines across four different platforms within two hours.
Go deeper
The viral mechanism is a mathematical rule independent of the news’s reality; it maps what suddenly attracts the attention of the masses. News spreading rapidly in a short time is generally big events, but it is often seen that fake news or an unconfirmed rumor can also meet the viral conditions (for instance, 2 references, 1 similar) in less than 3 hours. Therefore, the viral label is not a guarantee of the news’s accuracy, but merely a measurement of its momentum within the ecosystem.
2.4.5Spam Cluster: The Same Source Repeating Itself
Spam Cluster: The Same Source Repeating Itself
It is the automatic filtering mechanism preventing a source from manipulating the system by publishing the same news repeatedly within itself.
Different sources breaking the same news shows the magnitude of the event (authority); however, the same source constantly breaking the same news again with very minor changes is spam for the system. The system groups consecutive references coming from the same source into a cluster and does not grant an authority bonus.
Example: A site not being able to gain points when it republishes the same traffic accident news with five different links for SEO.
Go deeper
To gain page views (SEO) in digital media, publishers repeatedly put old news back into circulation as if it were a new breaking development. The spam cluster check easily catches these repetitions with the fingerprinting system running on the device. MagPunk does not hide these items, but it refuses to give them the +(8 × authority) authority contribution. Thanks to this rule, the user is protected from artificial content density, and the scoring structure of the app becomes secure against manipulations.
2.4.6Reports and Compare: How Did Two Sources Look at the Same Event?
Reports and Compare: How Did Two Sources Look at the Same Event?
It is the analysis screen calculating which source produced how much news and with how many minutes of difference and with what headlines they gave the same event compared to each other.
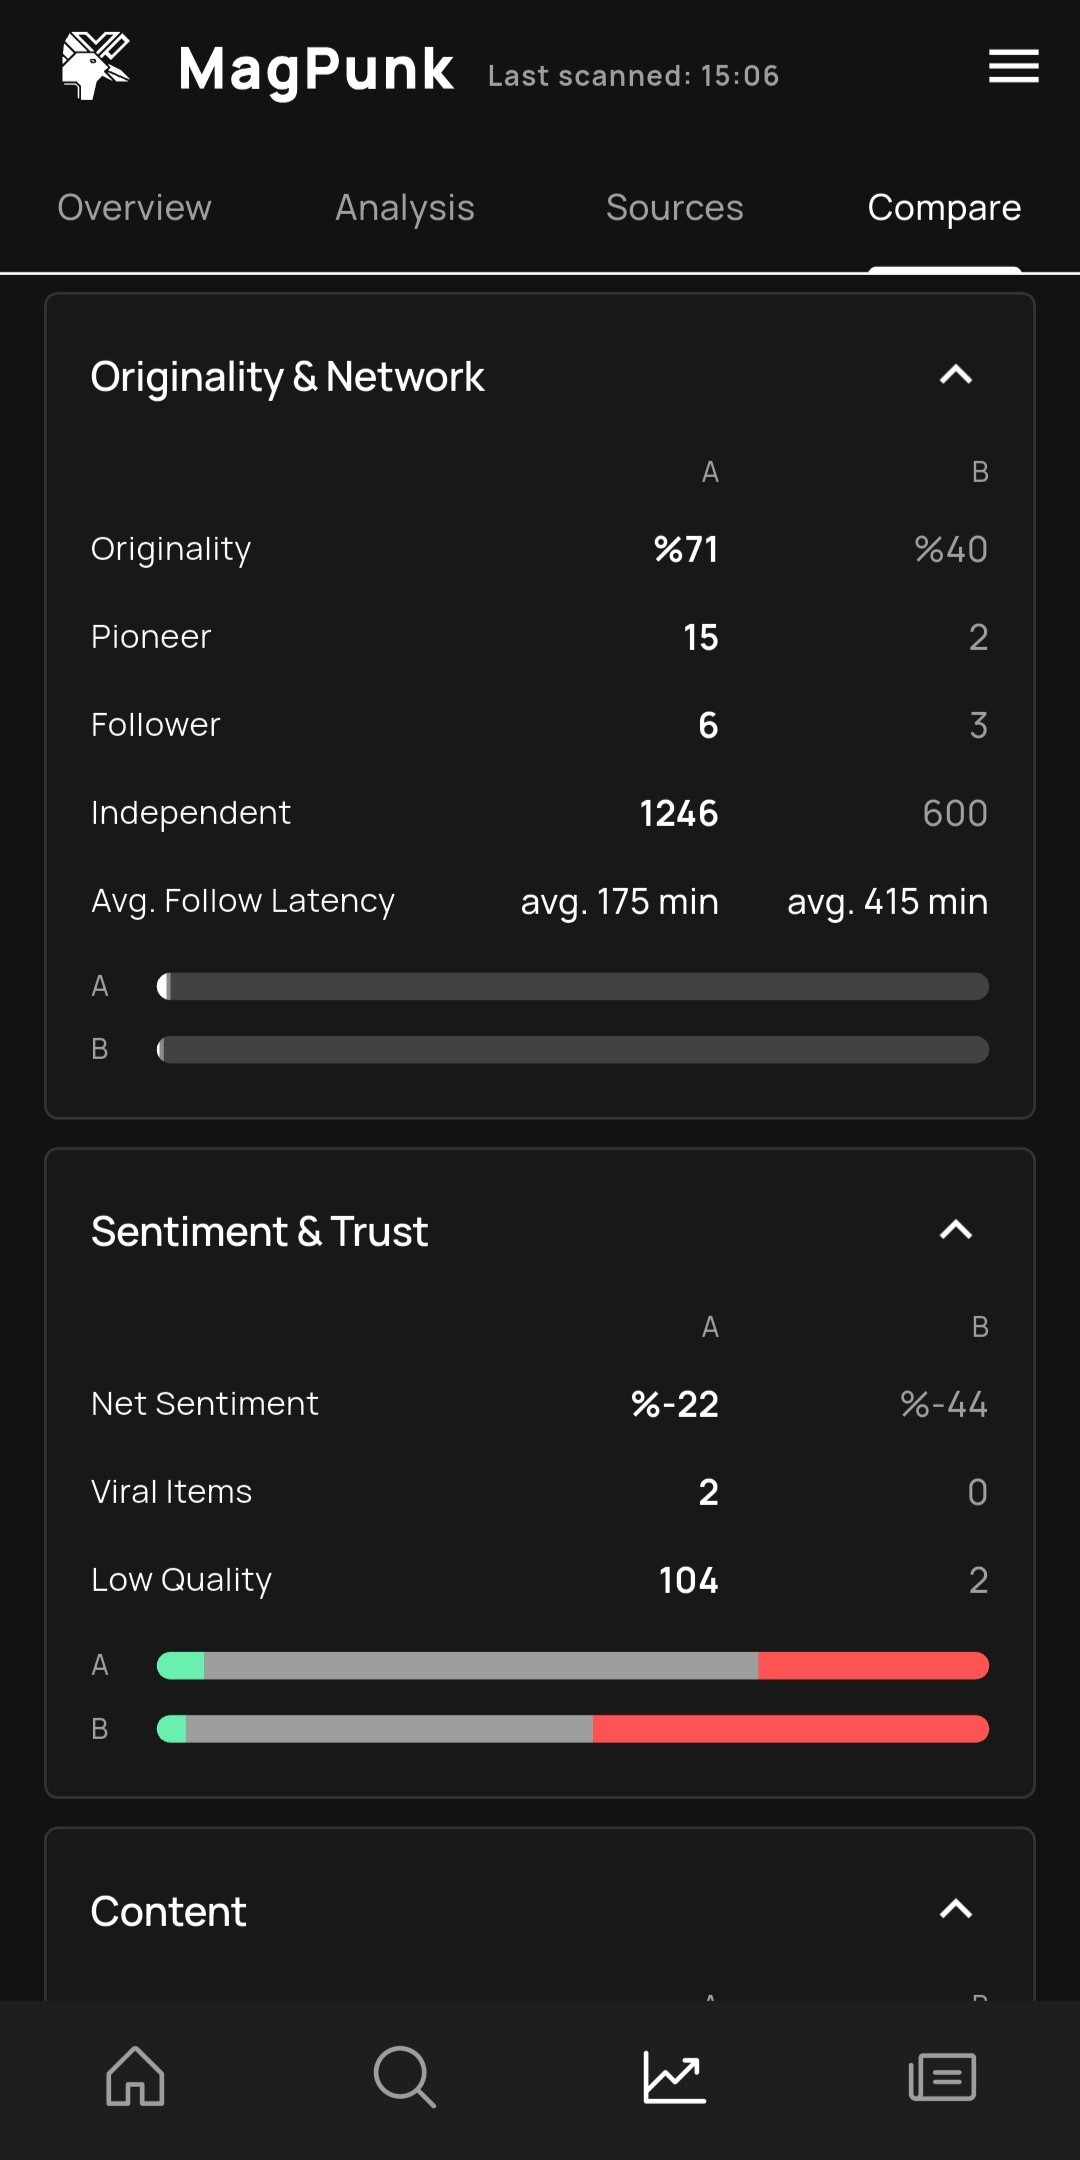
MagPunk does not secretly analyze your data in the background, it compares the news you downloaded upon your request. While you can see the overall performance of each source in the Reports tab, in the Compare tab exclusive to the Pro version, you can select two different sources and directly match their speed of giving the same news (for example, as “NTV agenda avg. 23 min behind”).
Example: Seeing side-by-side on the Compare screen how two different news channels looked at the same event, their headlines, and who broke the news first.
Go deeper
Media analyses can usually be done by companies with massive budgets or academics. MagPunk reduces this analytical power into a simple and understandable format and puts it directly at the user’s service. The tables in the Reports section are not calculated in the cloud; they are generated entirely under your control by passing the data on your device through fingerprinting operations (O(N·k) inverted index scanning along with the 3-letter words or 4-letter roots it eliminates). You can instantly compare over the reports which source produced how much content or repeated how much of it.
2.5 · How It Warns You
2.5.1The Seven Gates the Notification Passes Through
The Seven Gates the Notification Passes Through
It is the seven different check stages where a news item is silently tested inside the device before vibrating as a notification on your phone.
MagPunk does not disturb you with continuous notifications. For a news item to fall into your notification bar, it must pass through exactly 7 different gates within the system. All items (including critical ones) must exceed the 80 score threshold. The only privilege of critical items is that they bypass the category, language, and source filters. Thus, your valuable attention is not divided by ordinary developments.
Example: An ordinary accident news item entering the feed but not vibrating your phone because it could not pass the notification gates.
Go deeper
The notification gates are: (1) activity, (2) state, (3) hidden types, (4) criticality, (5) score (must exceed 80), (6) age, (7) hierarchy. Unlike traditional systems, these analyses run not by a remote server waking you up, but by the background scan waking up the device and checking the data itself (background fetch).
2.5.2Daily Brief and Flash Duration
Daily Brief and Flash Duration
It is the summary presenting you the 10 most important news of the last 24 hours in the evenings and the metric indicating the hotness duration of the events.
Every day at 19:00, your device extracts the summary of the last 24 hours and informs you. At most 3 of the 10 items entering the brief can be critical news. As for the flash duration in the system, it indicates the active time news that directly crossed the exact 80 threshold was able to stay above that value.
Example: Being able to read the summary of only the 10 most important ones out of hundreds of developments occurring throughout the day when you return home in the evening.
Go deeper
Briefs are the most effective and powerful antidote against continuous feed stress (FOMO). MagPunk evaluates the value of a news item not only at the moment it explodes, but by its persistence over time. Flash duration is a durability test showing how long the news stayed on the agenda; due to the exponential nature of the decay function, news with no value collapses rapidly, while the truly important ones can hold on above the 80 score threshold for long hours. The ranking of the news entering the brief is determined by the formula current score + flash duration; meaning not the oldest flash, but the one that remained a flash for the longest time stands out. You can shape the brief’s hour and content as you wish from the settings on your device (in the Pro version).

2.5.3Pulse: Source by Source High-Scoring Content
Pulse: Source by Source High-Scoring Content
It is the screen filtering the main feed and combining only the news that exceeded the ≥ 85 score threshold in the last 24 hours into a simple list.
The Pulse view is an ‘elites’ summary for those who do not want to read all the news. It consists of only the strongest items within the last 24 hours. Pulse is ordered directly source by source; it groups the highest scoring items of each source and the listing ceiling is a maximum of 15 items per source (source and threshold settings can be changed in the Pro version).
Example: When checking the news after a long journey, skipping the unimportant details and merely browsing the developments with a very high score.
Go deeper
The most visible feature of the Pulse screen is the ring color: If the newest timestamp is after the last seen, the ring is red, if not, it is gray. The item list starts from the first unseen item (skip-seen), so you do not have to scroll through the news you have already read again. Pulse is a focused lens extracting only the signal out of the noise.
2.5.4Watched Words — and Why They Don't Change the Score
Watched Words — and Why They Don’t Change the Score
It is the feature allowing you to define the words you want to track, so you can see the news containing these words colorfully or prominently in the feed.
Watched words are a visual marker and increase permanence (exempting the item from archive cleanup); however, they do not grant your device the authority to change the score of that news directly. If a specific word you chose added points to the news, you would have created an artificial echo chamber with your own hands. For this reason, the score bonus belongs only to the trending words detected by the system.
Example: When you watch the word ‘space’, the news containing this word being underlined in the feed but not jumping to the very top.
Go deeper
The point where readers fall into fallacy the most is the belief that the topics they are interested in should have a high score. However, according to MagPunk’s philosophy, the objective information value of a news item does not change based on your area of interest. You can track up to 5 words in the system (in the free version). While watched words do not affect the score, trending words determined by the device naturally get included in the score with +7, +4, +2 points respectively based on the word’s age (e.g. <6 hours, 6-12 hours, ≥12 hours). Visualize your interests, but do not allow them to interfere with the system’s value judgments.
2.6 · What It Doesn't Do, What It Cannot Do
2.6.1Honest Report Card — Numbers Measured in a Real Feed
Honest Report Card — Numbers Measured in a Real Feed
The honest report card is the version of labeling performance measured not in a laboratory environment, but on a natural distribution real feed.
The measurement was taken on July 17, 2026, on 1110 titles that never went into training, with calibrated thresholds on the device. Values are given separately by language, because the model behaves differently in every language. P shows how many of the ones we labeled were correct, R shows how many of the ones that should have been labeled we caught. The weak rows are also staying in the table; there are no cut or rounded numbers.
| Task | P | R | F1 |
|---|---|---|---|
| Low Quality · TR | 0.99 | 0.61 | 0.75 |
| Low Quality · EN | 0.75 | 0.43 | 0.55 |
| Critical · TR | 0.90 | 0.52 | 0.66 |
| Critical · EN | 0.87 | 0.87 | 0.87 |
| Sentiment · Negative · TR | 0.76 | 0.80 | 0.78 |
| Sentiment · Negative · EN | 0.75 | 0.69 | 0.72 |
| Sentiment · Neutral · TR | 0.83 | 0.86 | 0.85 |
| Sentiment · Neutral · EN | 0.68 | 0.84 | 0.75 |
| Sentiment · Positive · TR | 0.67 | 0.48 | 0.56 |
| Sentiment · Positive · EN | 0.86 | 0.46 | 0.60 |
Example: In Low Quality TR, precision is 0.99, recall is 0.61. When it stamps the label, it almost never errs, but it catches only a portion of the low-quality items.
Go deeper
Even the scores of a test set that never went into training (held-out) are too optimistic: in the same task, Low Quality TR comes out as 0.95 there. The reason is that that pool is a laboratory environment enriched by rare class mining. Only the natural distribution report card above reflects the performance in a real feed.
Thresholds are chosen not to enlarge F1, but to maximize recall without falling below the precision floor. The floor is language-specific: 0.90 for low quality TR and EN, 0.90 for critical EN, 0.80 for critical TR. This is the reason why recall values appear low and it is a conscious choice — missing is preferred over stamping a wrong label.
Positive sentiment is the weakest link in every language: it is both rare and the “if in doubt, neutral” rule deliberately leaves it unprotected.
2.6.2Only the Title is Read: Information Ceiling
Only the Title is Read: Information Ceiling
It is the limit of the model and the rule engine looking only at the title of the news, not the full text of the news, while doing their analysis.
The machine learning model and rule engine on your device do not analyze the content of the news. Since the system makes its decisions by focusing solely on the news headline, details not clearly reflected in the headline cannot be measured and included in the score. This design makes it impossible to detect the fine details or context carried in the body text.
Example: The system being able to mark it as low quality if the headline is inadequate, even if the text of the news is highly detailed.
Go deeper
Many publishers throw the headline in a provocative way, hiding the actual information inside the text so that the reader clicks on the news. MagPunk reading only the title is a conscious limitation. Analyzing the full text of every single news item on your device rapidly consumes your hardware resources and creates a serious data processing load by going beyond the offline 60-word summary panel. The system measures the headline, which is the publisher’s first promise to the reader; the rest is left to the user’s own deduction.
2.6.3Does Not Do Fact-Checking
Does Not Do Fact-Checking
It is that MagPunk lacks the ability to research whether a news item actually happened or whether the information is correct.
The system does not confirm the reality of the data (names, numbers, or events) in the outside world. The app only measures the statistical tone of words and the spreading speed of news in reference to each other. When a news item is produced entirely as a lie or fiction by the publisher source, the system cannot perceive this.
Example: The system counting a fabricated event as critical or viral in case it spreads with capital letters across ten different sources.
Go deeper
Fact-checking requires journalistic principles, deep research, and often human judgment. Machine learning models learn data, not events. The classifier algorithm running on your device cannot detect the false because it does not know the truth. Testing accuracy is a demanding mental task that the reader must personally do by comparing different sources with each other (via the reports or reference clusters provided by MagPunk).
2.6.4Does Not Measure Neutrality
Does Not Measure Neutrality
It is the inability of the app to detect the ideological stance, political position, or how objective a news source is.
MagPunk cannot claim that any content is politically impartial or neutral. The system only measures negative, positive, and neutral sentiment, this statistical emotional tone is not the equivalent of neutrality. A news item being intensely partisan can also be hidden by using statistically ‘neutral’ words.
Example: A group producing a text that is actually wholly one-sided and biased by choosing its words very carefully and neutrally.
Go deeper
No text produced by humans is objective in an absolute sense. Classifiers (TF/IDF weights or sentiment rule engines) can score the tone of words on the surface, but the actual intention or ideological frame (framing theory) behind the text is too complex for algorithms to reach. That is why, as per the political neutrality rule, the model refrains from interfering with political content. Admitting that neutrality is immeasurable is the first step of critical thinking.
2.6.5Labels Are a Statistical Estimate, Not a Verdict
Labels Are a Statistical Estimate, Not a Verdict
It is that no badge or label you see on the screen signifies a definitive truth or a final verdict.
All of the labels like low quality or critical stamped by the app consist of a simple probability calculation. The machine learning model (≈7 MB in size) and the threshold values behind it reflect a mathematically determined probability onto the screen. While the system operates, it can sometimes be wrong and produce incorrect labels from time to time.
Example: The system statistically making a mistake in one out of every ten decisions even in a setting where it operates with ninety percent (0.90) precision.
Go deeper
The decisions of a statistical system depend on the data that system was trained on (36,002 pieces of training data) and the targeted precision floors. Even though the report card values (for example, F1=0.75 in Low Quality TR or F1=0.87 in Critical EN) show the general performance of the system, a margin of error is always present in every individual decision. The app does not tell you the definitive reality of a news item; it merely presents a forecast according to its own internal rules.
2.6.6Did You See a Wrong Label? → Feedback
Did You See a Wrong Label? → Feedback
It is being able to report a piece of content the model incorrectly labeled to us, after personally seeing and confirming what will be sent.
You cannot manually change the label inside the app; this is a conscious choice, because a correction on a single device does not train the model, it only breaks that content. Instead, you tap the “report error” link in the reading panel, mark which label is wrong or which one is missing. It is copied to your clipboard and the submission page opens in the browser. Nothing leaves your device until you say “Submit”.
Example: An ordinary news item receiving the critical label because of the words inside it, and you reporting this after reading the text to be sent.
Go deeper
The flow has two steps and both are under your control. The app only prepares the report text and copies it to your clipboard; the submission is made from the web form opened in the browser. The only thing reaching the form is the content of that text box — device ID, account, or location do not go, IP and browser info are not stored. You can read, shorten, or abort before sending the text.
Incoming reports do not enter model training directly; they are first examined manually. Only the ones passing the review are evaluated as hard-negative examples in the next training round. This is the way the next model is better than today’s, but a single report alone does not change any label.
For the full inventory of where data goes, you can look at 2.1.6, and for the details of the process at the /en/feedback/ page.